Notifications and Analytics
Before you start
- The number next to Notifications in the sidebar, and on the bell at the top right, is how many you haven't read yet.
Steps
1. Glance at notifications from any page
Tap the bell at the top right.
You should see: the Notifications panel with All and Unread, your newest notifications, and View all notifications at the bottom.
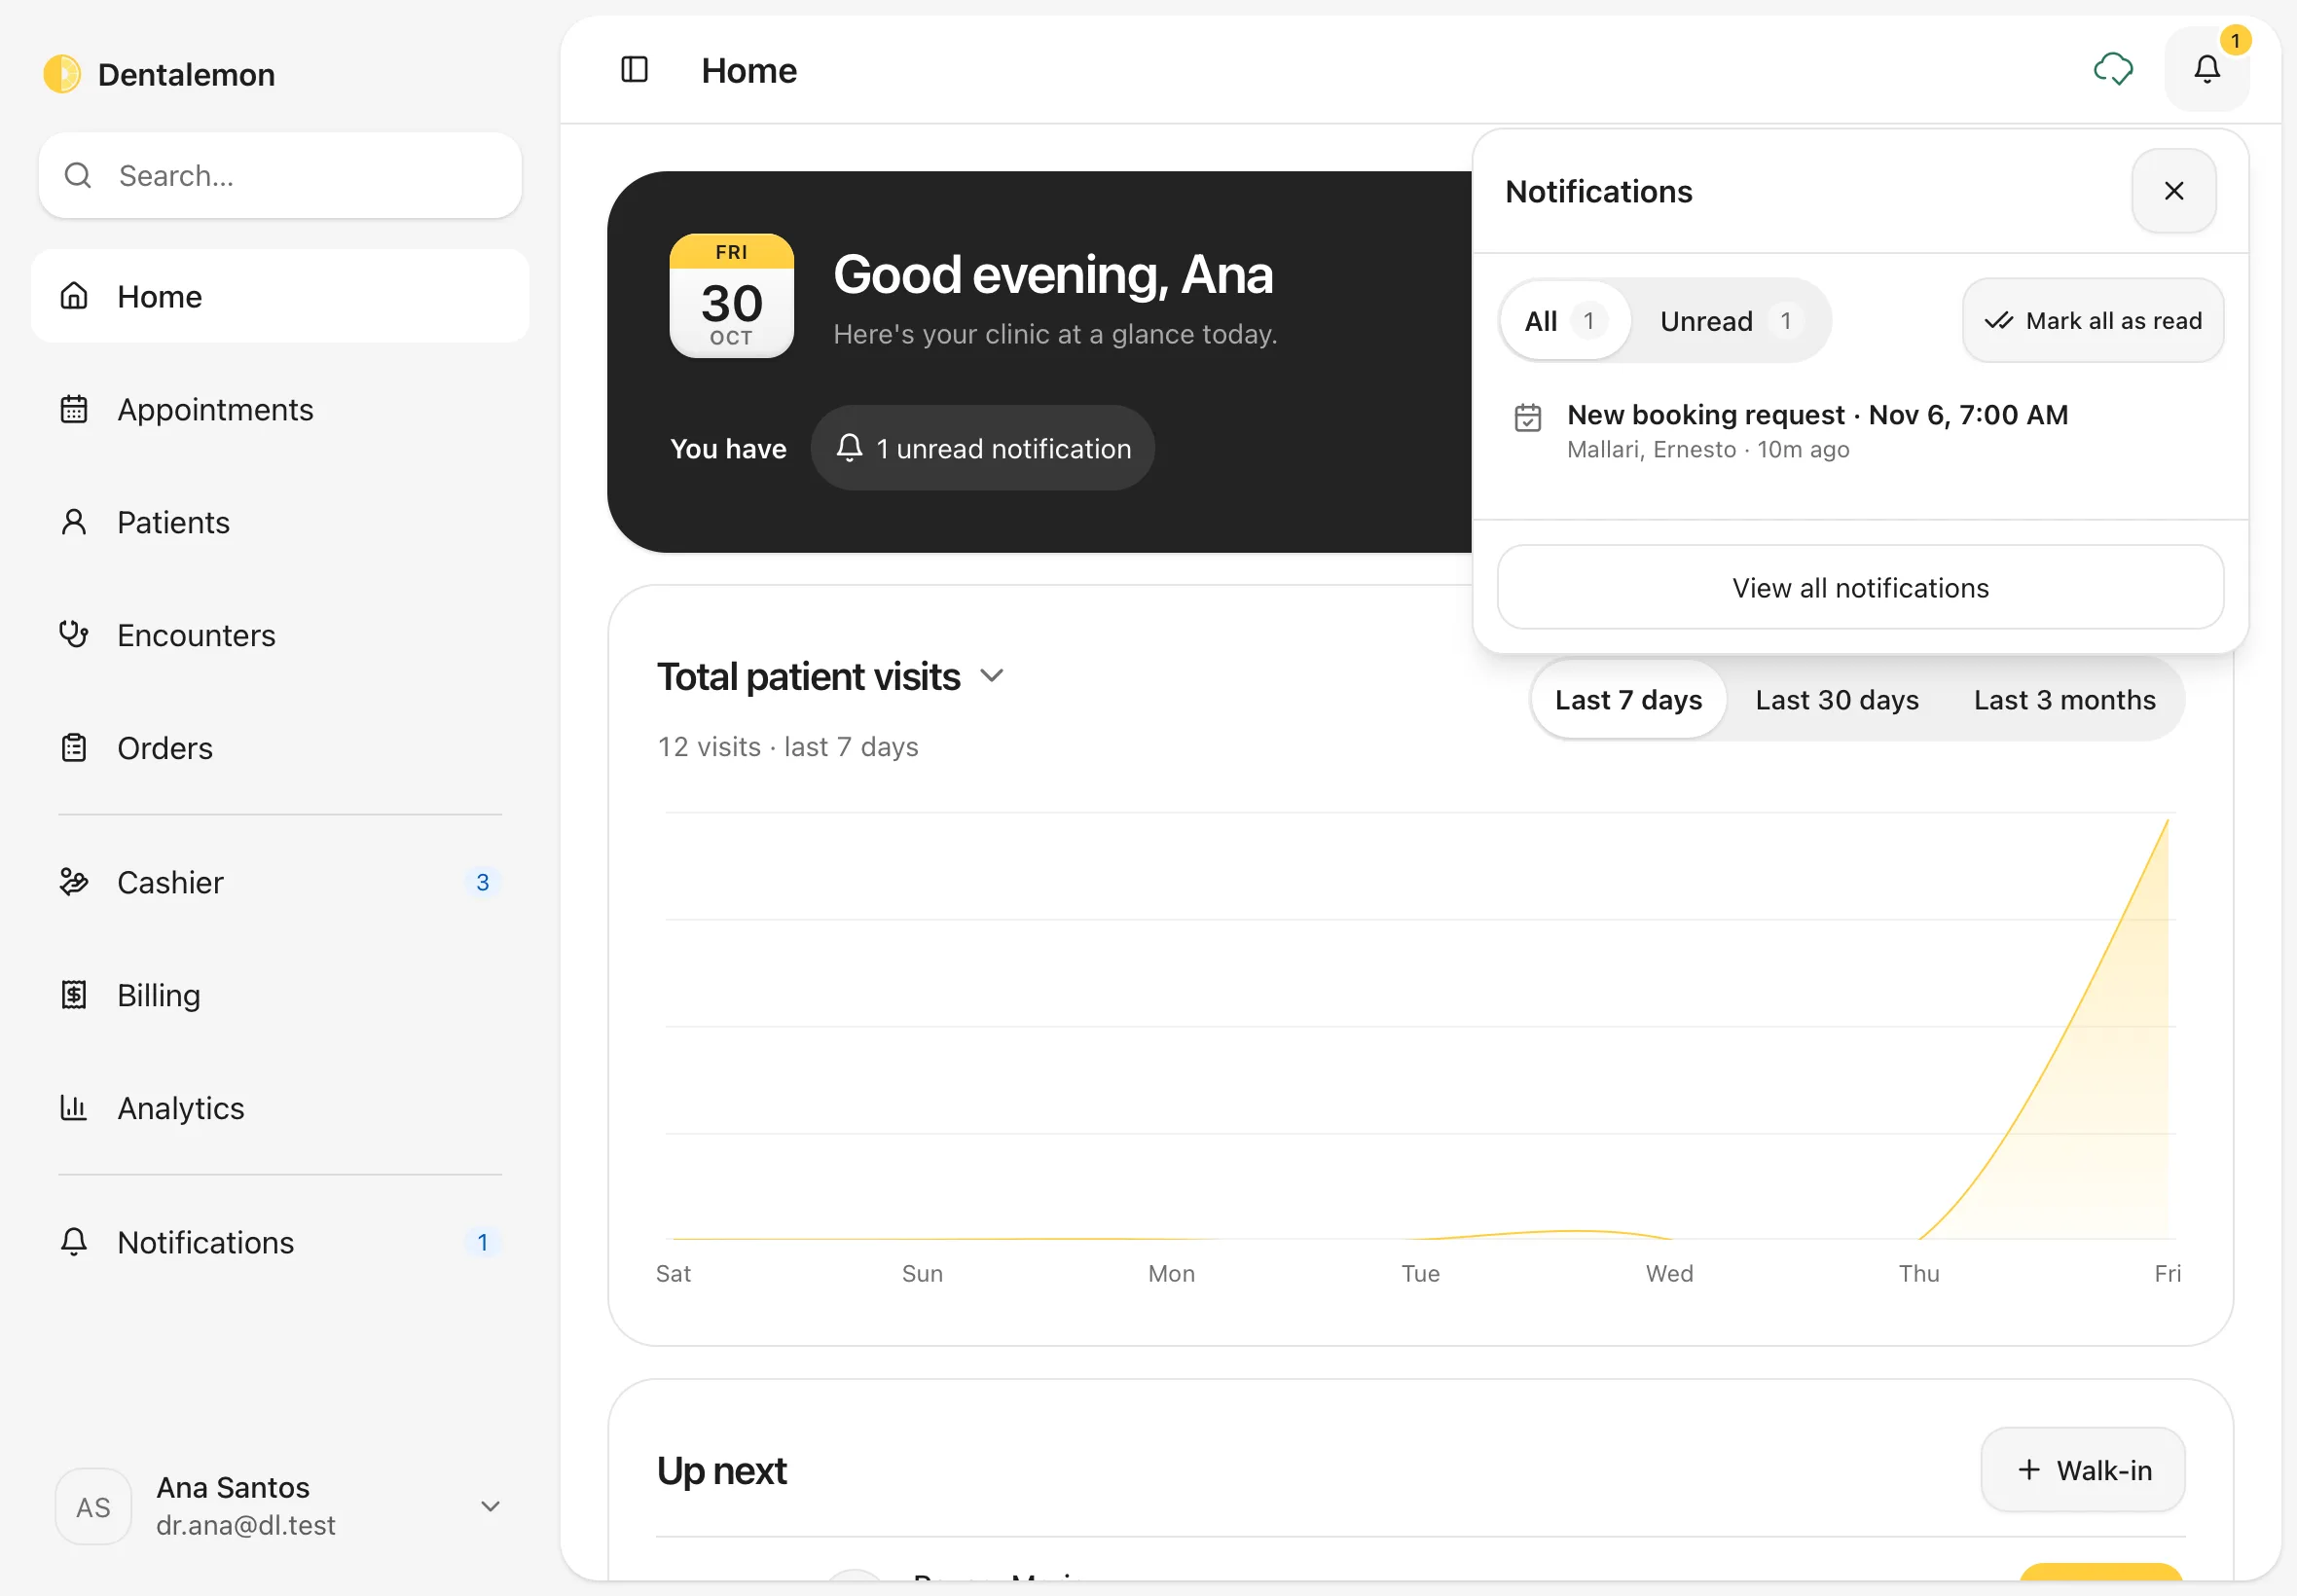
Tap a notification to open what it's about. To mark one read without opening it, swipe it to the left and tap Mark as read. On a read notification the same swipe shows Mark as unread.
2. See all your notifications
Tap Notifications in the sidebar, or View all notifications in the panel.
You should see: a search box, All and Unread, a Type filter and Mark all as read. Critical items are grouped under Needs attention at the top, then Today, Yesterday and Earlier.
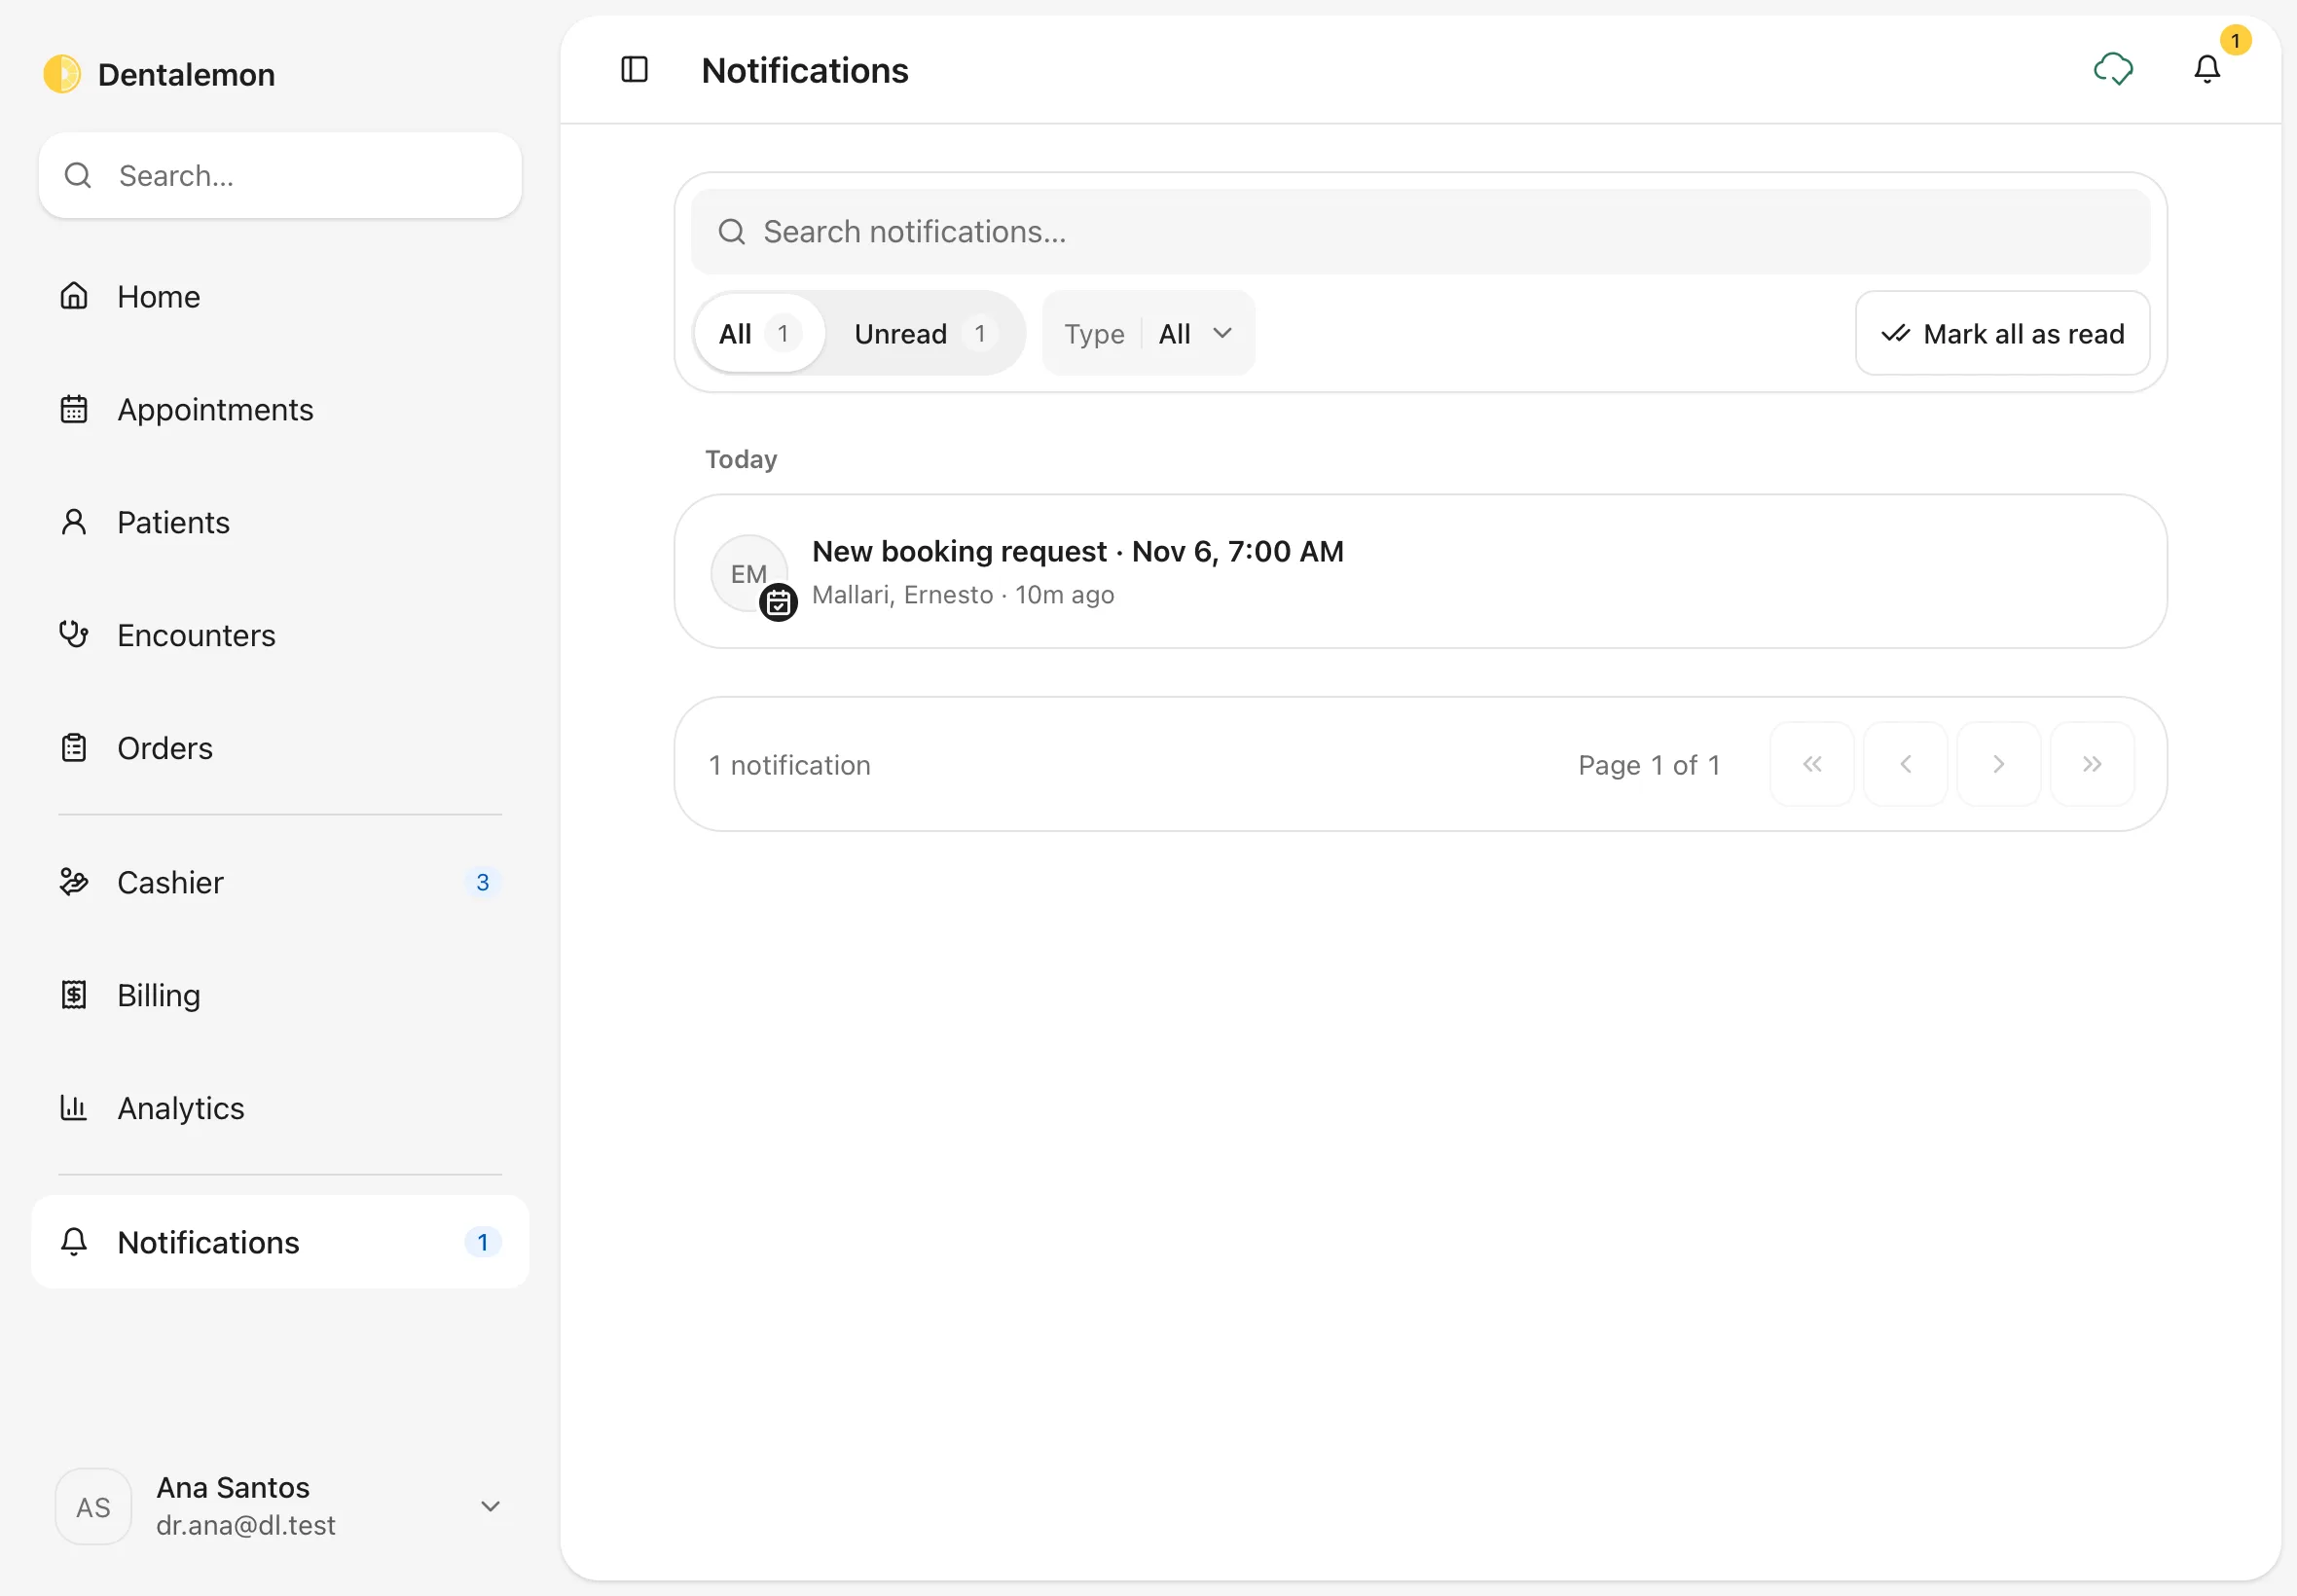
Mark all as read marks everything read. A note with Undo appears for a few seconds in case you tapped it by mistake. Swipe a single notification to the left for Mark as read or Mark as unread.
3. Open Analytics
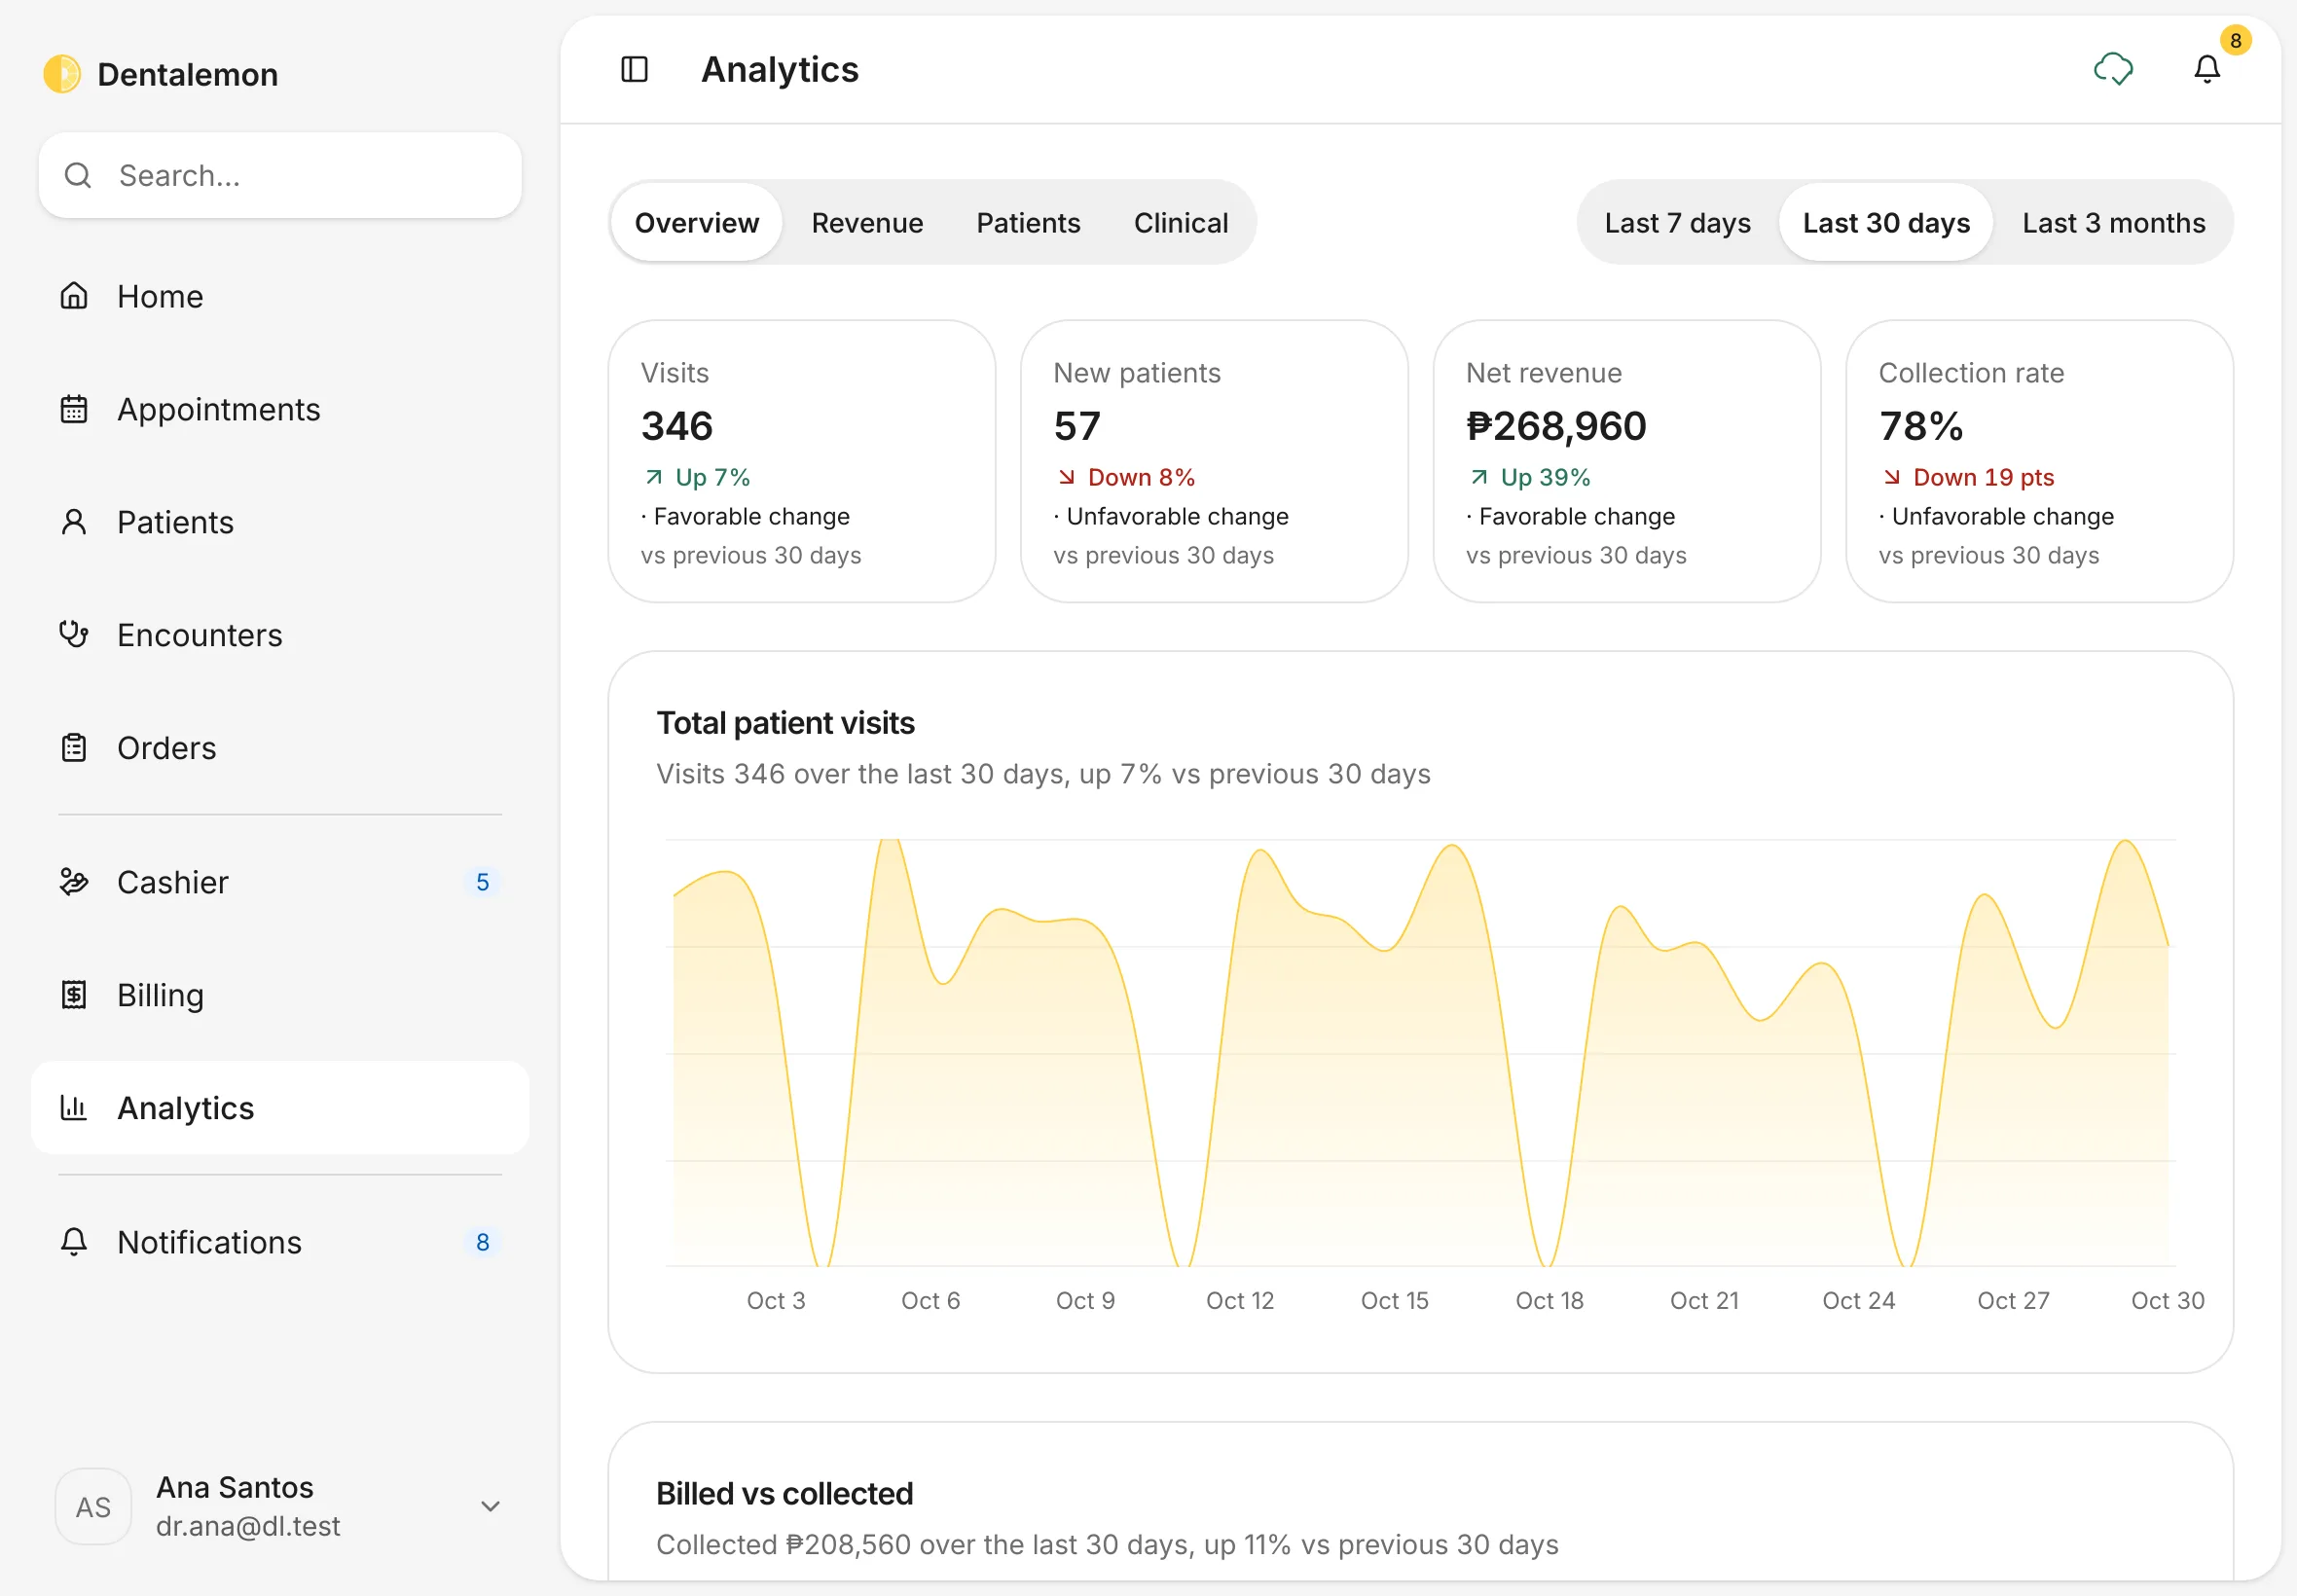
Tap Analytics in the sidebar. Pick a range at the top right: Last 7 days, Last 30 days or Last 3 months.
You should see: the Overview tab with Visits, New patients, Net revenue and Collection rate. Each is compared with the previous period of the same length (for example Up 7% · Favorable change vs previous 30 days). A new clinic's tiles say No earlier period to compare until there is one. Below are the Total patient visits and Billed vs collected charts.
4. Revenue
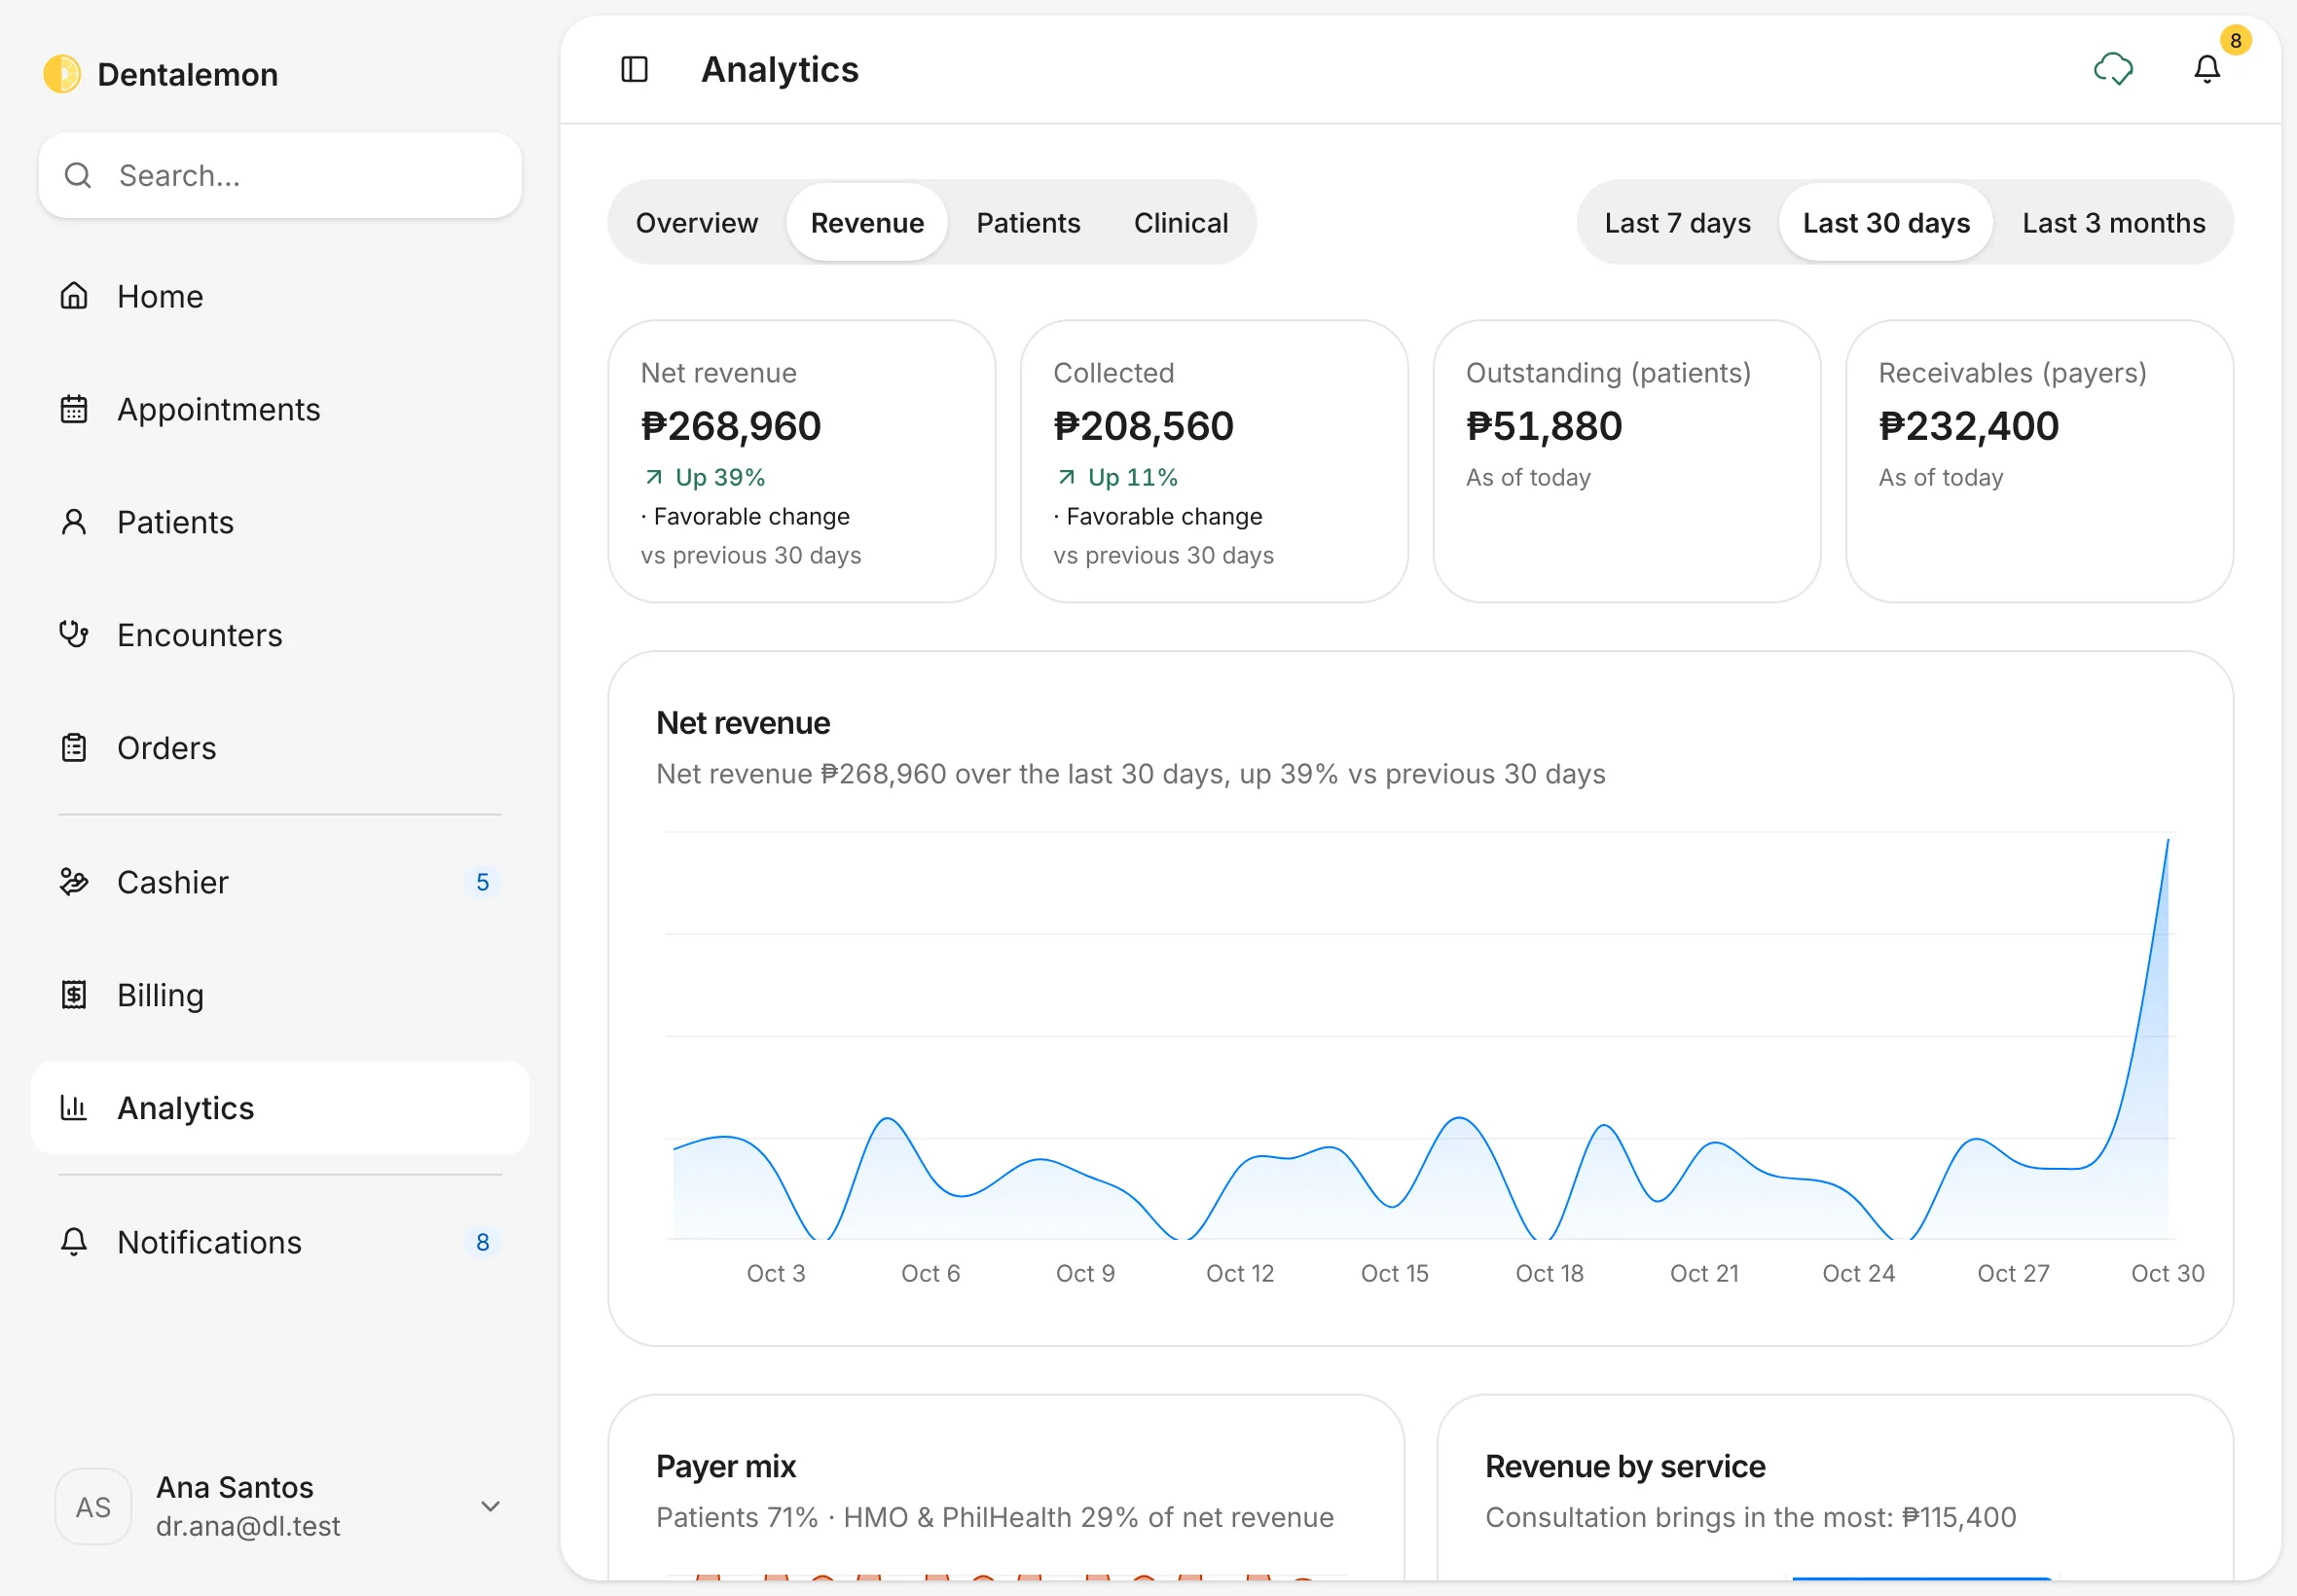
Tap Revenue: Net revenue, Collected, Outstanding (patients) and Receivables (payers), a revenue chart, then Payer mix, Revenue by service and Receivables aging (what payers owe, by how long).
You should see: the four money tiles and the Net revenue chart.
5. Patients
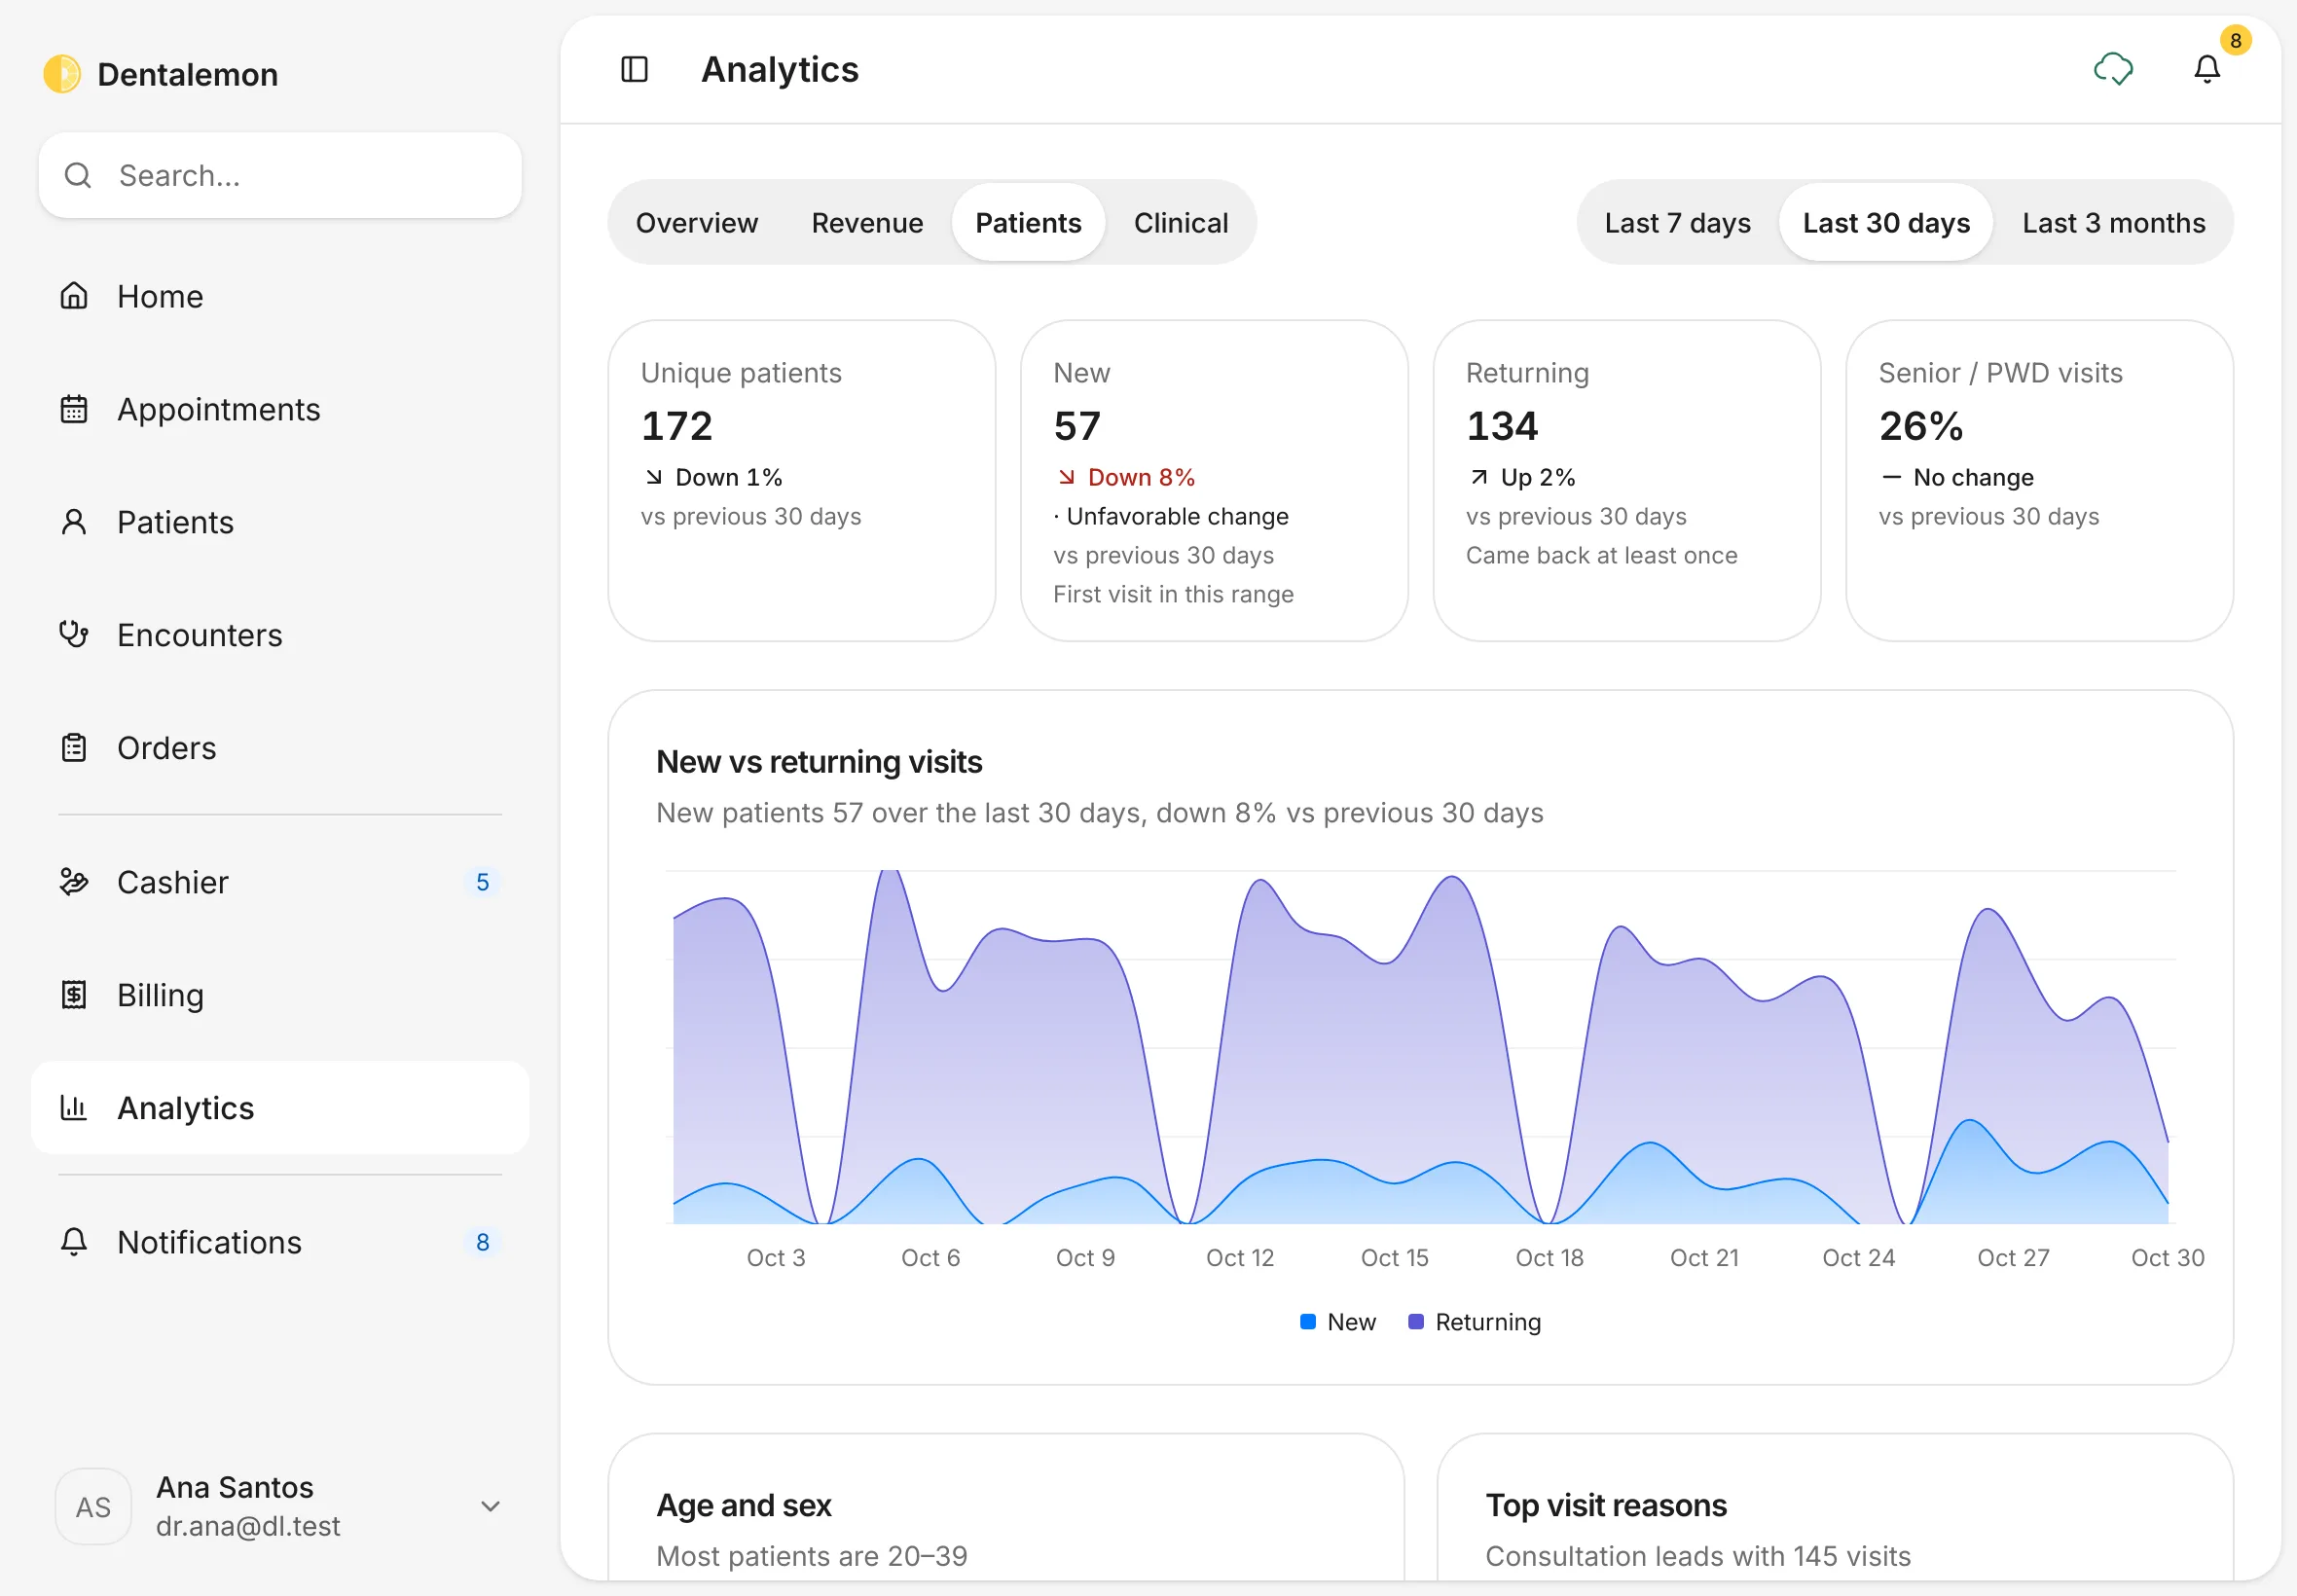
Tap Patients: Unique patients, New, Returning and Senior / PWD visits, the New vs returning visits chart, then Age and sex and Top visit reasons.
You should see: the four patient tiles and the New vs returning visits chart.
6. Clinical
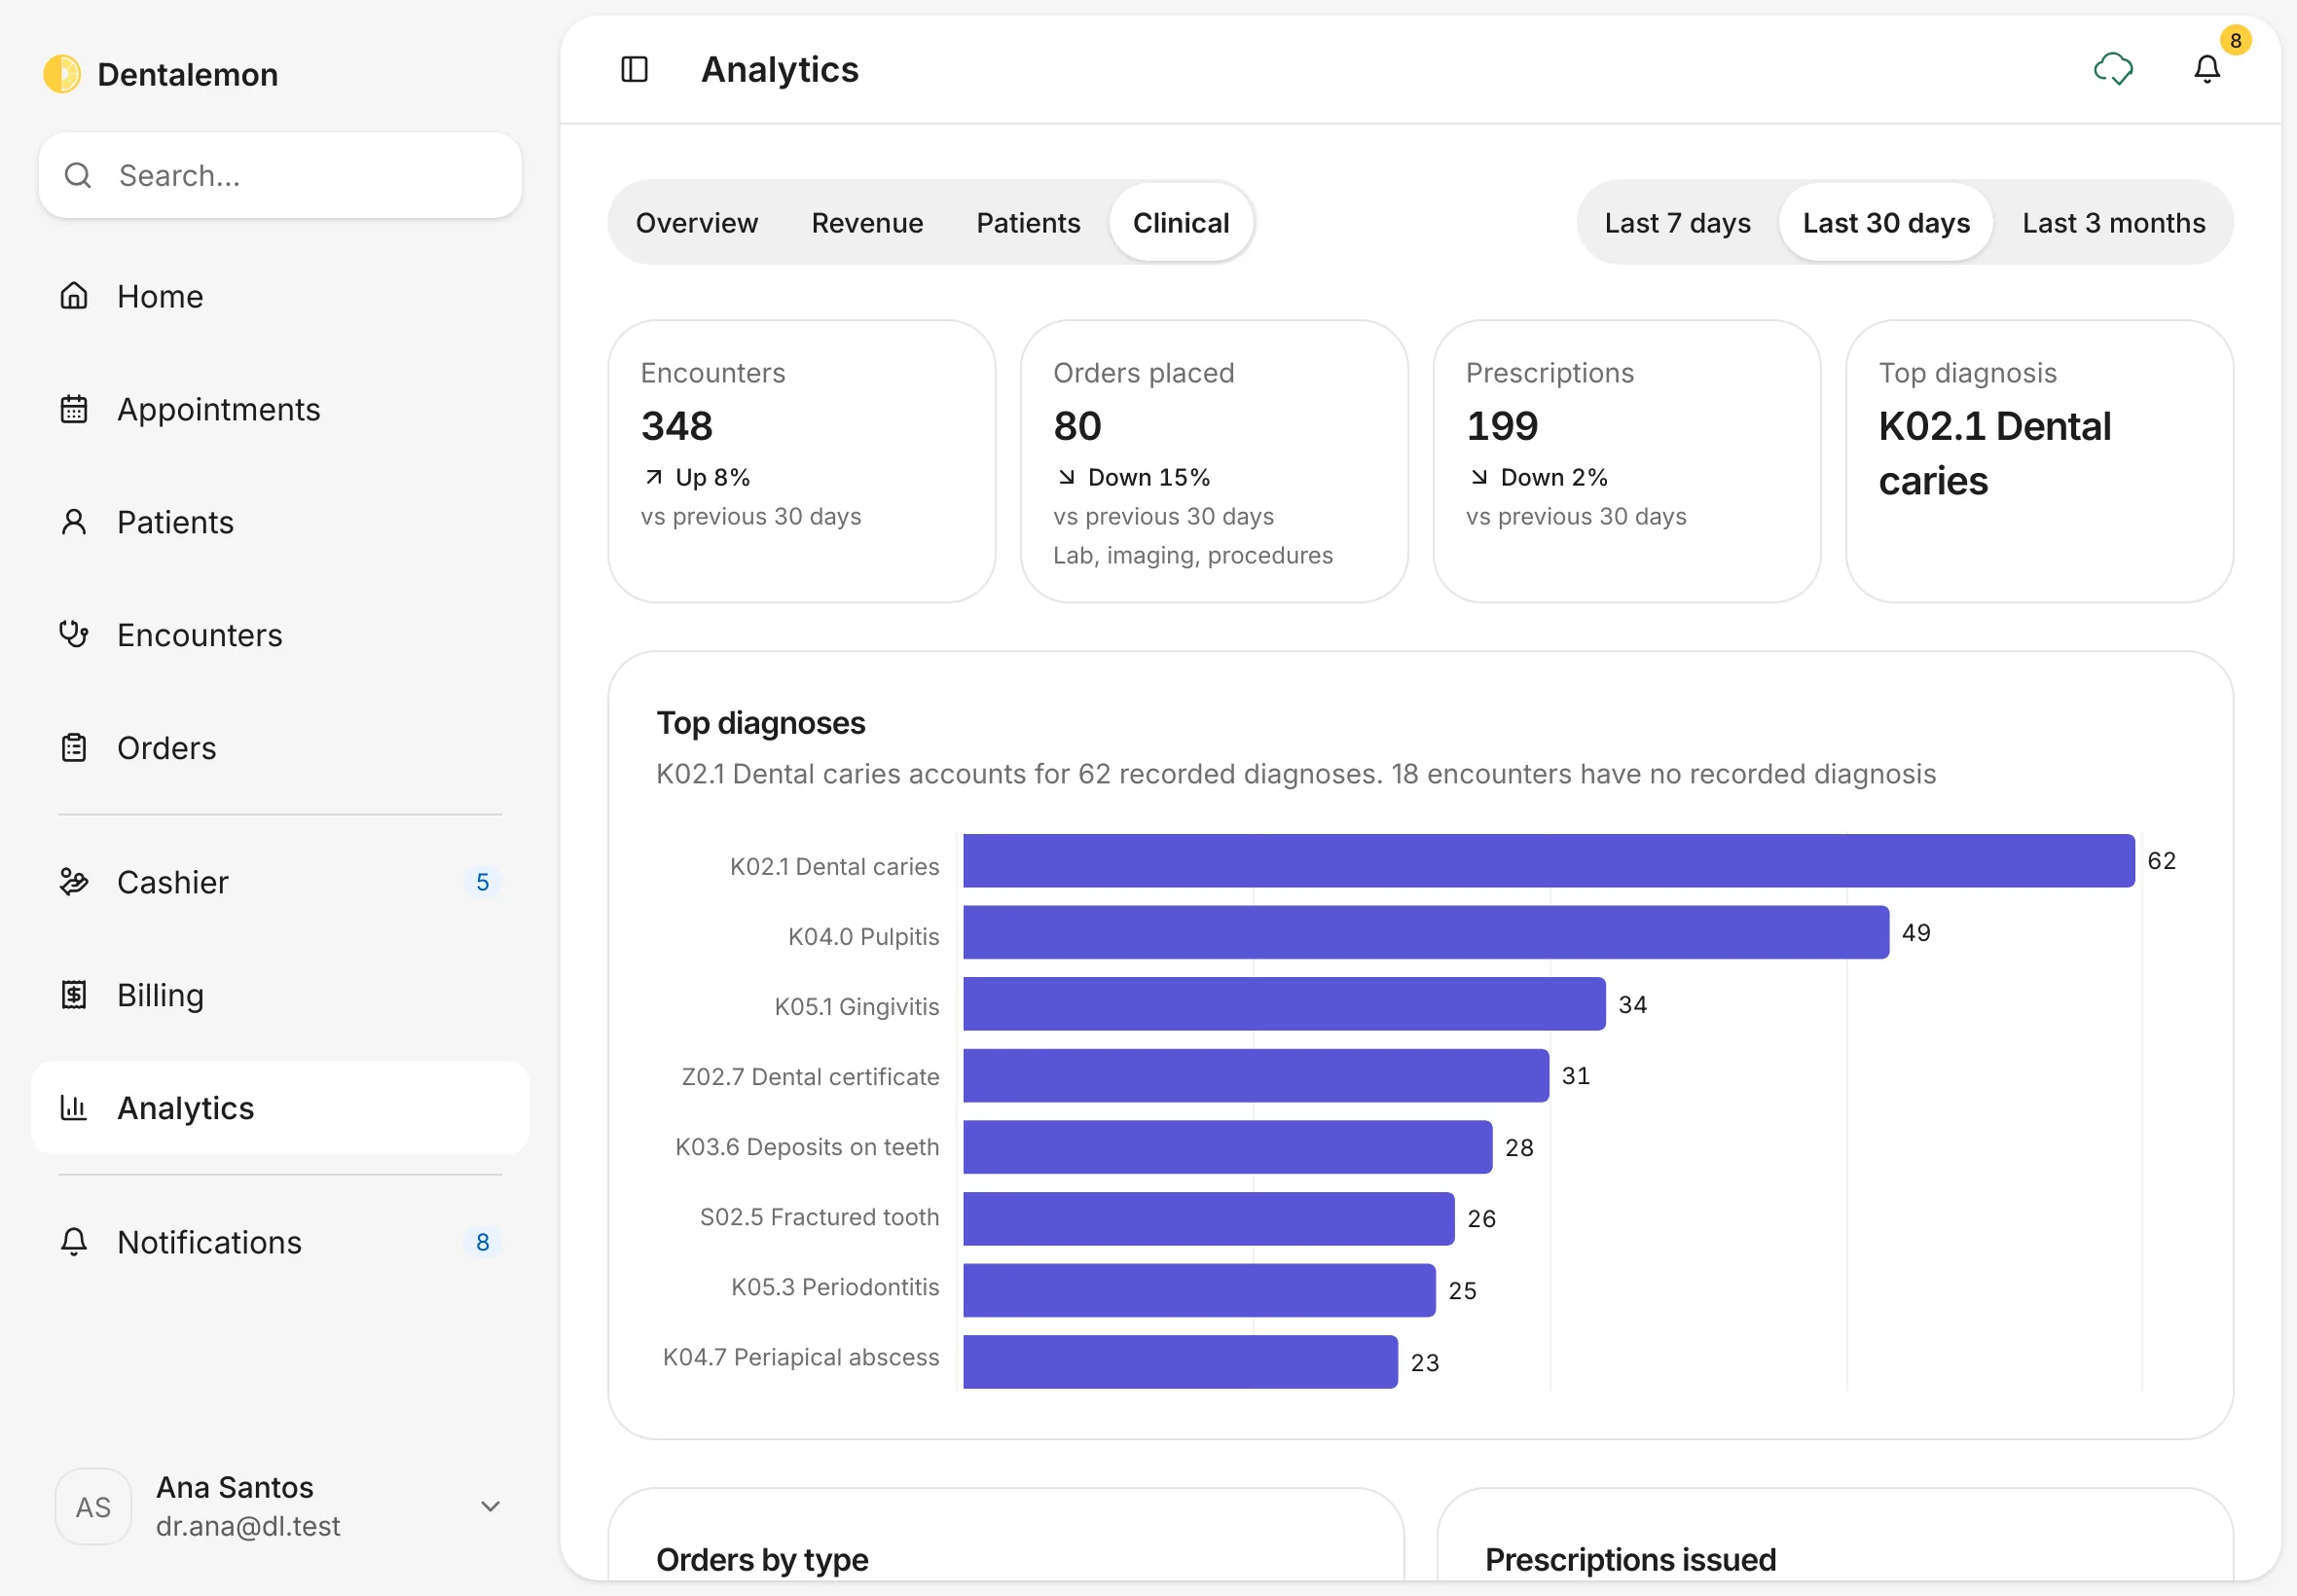
Tap Clinical: Encounters, Orders placed, Prescriptions and Top diagnosis, then the Top diagnoses chart, Orders by type and Prescriptions issued.
You should see: the four clinical tiles and the Top diagnoses chart.
Tips
Turn off the ones you don't need
In Settings › Notifications you can mute types of notifications you don't want to see.
Good to know
- Notifications only appear inside Dentalemon. There's no email or text message.
- Top diagnoses only counts visits where a diagnosis was recorded. The chart says how many visits had none.